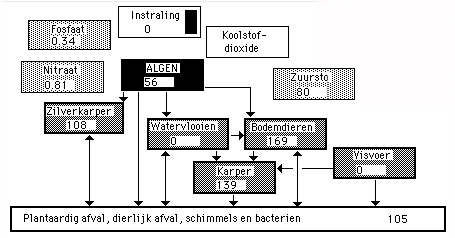
Figure 7.1 The model of the computer simulation program VIJVER. (Svirezhev, et.al., 1984)
This chapter discusses:
For this reason a mathematical model of a fish pond can serve two purposes: fish pond management and education. The model constructed by Svirezhev et al (1984) simulates a fish breeding pond in which three fish species are present: carp, silver carp and bighead carp (see figure 7.1). Van Schaick Zillesen adapted the model for a pond in which only two fish species are present (carp and silver carp).
The program FOOD CHAIN is based on the adapted version of the model of Svirezhev et al. Svirezhev et al. (1984) give values the parameters used in their model. However, they do not give starting values for the variables of the model. Labordus (National Institute for Curriculum Development) gathered the data about the values of these variables from literature.
Educational value
The prototype FOOD CHAIN is designed for students in secondary education and lower vocational training. Before the start of the simulation, students should have advance knowledge of ecological processes in the fish pond. This advance knowledge is reinforced during the use of the simulation program.
Before the start of the simulation the students should be aware of the following ecological processes:
Apart from the reinforcement of this knowledge, the program is also used to teach new phenomena like:
The prototype can simulate five ponds. In each pond oxygen, nitrate, phosphate and detritus (a complex of organic material and fungi and bacteria) are present. The following ponds can be simulated:
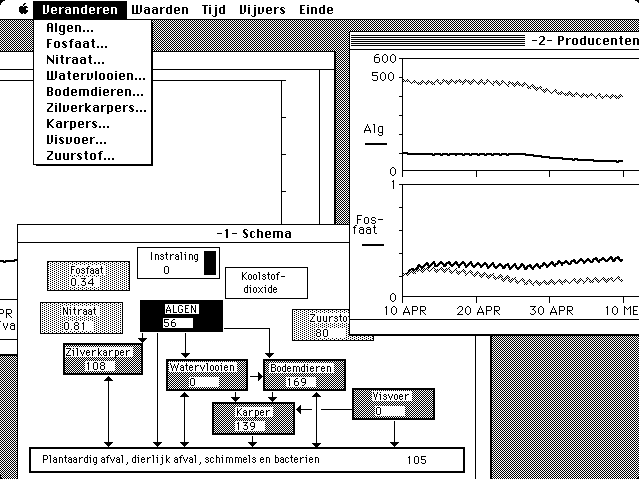
Figure 7.2 Input window of the computer simulation program VIJVER with the conceptual model of a fishing-pound according to Svirezhev et.al.
Pond 5 (Fish Pond). In this pond the following organisms are present: phytoplanton, zooplankton, benthos, carp and silver carp. A student studying this pond is able to feed the fish with artificial fodder. Furthermore, he or she can re-aerate the water in the pond.
The program has been used in many levels of education varying from lower
vocational training to a university course.
In lower vocational training only the most simple ponds (pond 1 and
pond 2) are studied. The other ponds are too complicated to be understood
by the students.
In secondary education all ponds can be studied. However, ponds 2,
3 and 4 are rather similar to each other. Because of this one or two of
these ponds are usually skipped.
Hartsuijker et al. (1989) developed paper materials, which can be used in combination with the simulation program. Their publication consists of the following parts:
A complete computer simulation supported learning environment can be constructed by combining the educational computer simulation program with the paper materials.
Description
The program FOOD CHAIN, version MacTHESIS, is designed by Van Schaick
Zillesen, (1988) according to the description of the students' learning
environment of MacTHESIS.
In this application four windows are present:
In the first window the internal structure of the simulated pond is visualized by means of a diagram. The values of the main variables are indicated in the diagram by means of digits. Day and night conditions are indicated by means of animation techniques. Students can change the values of parameters and variables in the model by clicking in the grey rectangles in the diagram. In each pond different interventions are possible:
The second window contains time registrations of the quantities of phytoplankton,
oxygen, nitrate and phosphate in the pond.
The third window contains time registrations of the quantities of carp,
silver carp, zooplankton and benthos in the pond.
The fourth window contains a time registration of the quantity of detritus
in the pond.
Students may intervene with the model by means of the input-animation technique as described earlier. Furthermore, the same interventions are possible by means of the menu bar.
At the start of the program pond 1 is presented to the student. The other ponds can be selected by means of the menu bar. There is a MS.DOS version of the program FOOD CHAIN available. Since 2001 there is a internet version of the program FOOD CHAIN available. (see figure 7.3, 7.4 and the interactive applet).
Van Densen and Pet included some phenomena in their model in order to
accommodate it to the specific conditions of Lake IJssel. Beside gill net
fishery another, usually less important, type of fishery was simultaneously
described by the model: fyke net fishery. Furthermore, the model provided
for inter-year temperature fluctuations and for fluctuations in the characteristics
of fishery.
However, these specific and to some extent obsolete characteristics
might confuse the students and distract them from the more general educational
objectives of the simulation program (like the effect of the prototype
FOOD CHAIN on university students). For this reason a more generalized
model might be more useful for educational purposes. The original model
of Van Densen and Pet was generalized for this purpose by Mous (1989).
PERCH is based on this generalized model. PERCH simulates gill net fishery
on perch only. Fyke net fishery and fishery on pikeperch are not included.
Inter-year fluctuations in fishing efficiency, temperature and recruitment
are not included in PERCH. Furthermore natural mortality has been made
length-independent and intra-year fluctuations in fishing effort before
and after the close season have been omitted.
Educational value
With the simulation program PERCH students can study the effects of several management measures (increasing or decreasing the fishing effort, changing efficiency and mesh size of the nets, adjusting the close season) on the distribution of the catch and on the structure of the population of a single fish species under conditions of gill net fishery. It is hard to understand the mutual dependency on the effects of these measures when the concepts are taught in a purely theoretical way. PERCH allows the students to build a conceptual model of the relations in the Lake IJssel system and to adjust this model to concrete experience gained by active experimentation. By means of induction students will generalize from the specific case of Lake IJssel to more general concepts of fishery management. The conceptualization's of these general concepts may help students specializing in fishery management to solve other fishery problems which they may meet in their future careers. Apart from courses of fishery management PERCH can also be used in more general university biology courses like courses of population dynamics or courses of nature management. In these courses PERCH may be used as an example for the way modelling techniques are applied in fishery management and in nature management in general.
Results
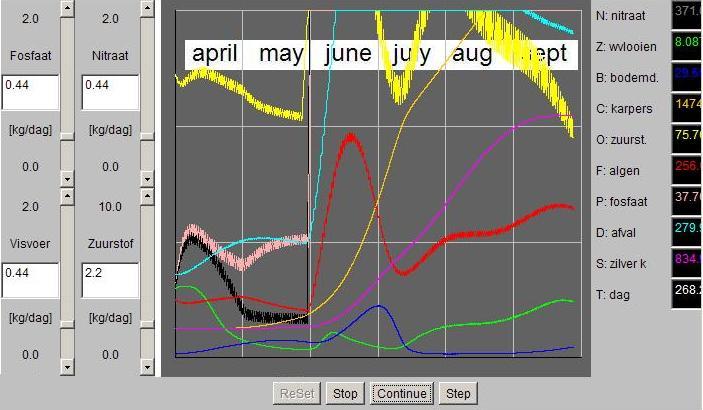
During simulation time the student can study 30 screens with graphic output showing the characteristics of the Lake IJssel system. The output consists of two display forms: dynamic graphs and dynamic, model-driven histograms. In the dynamic graphs time registrations of the following variables are presented:
In the model-driven histograms the distributions of the following variables are presented:
In many cases it is relevant to the students to attain information about the development of a specific age class or about a specific sex of the fish population. Furthermore, in some cases it is relevant to compare the exploited situation with the unexploited situation. In these cases a more detailed output is provided (e.g. separate time registrations for age class or for each sex).
The results of the simulation are stored in a file. This file has a heading in which the initial values are given of the parameters used in the simulation. During simulation, tables are written to this file containing the values of the variables shown in the displays described above. Tables are generated automatically at the start of the close season, on day 273 and on day 365. Furthermore the student may order the generation of a table on-line during runtime using the option 'write' at simulation level. Beside starting initial values of parameters and tables the following information is recorded in the file in order to facilitate the reconstruction of the course of the simulation later on:
During simulation the student can change the following parameters by means of a pull down menu:
Note: This chapter is first published by P.G. van Schaick Zillesen in his Ph.D thesis at the University of Twente, Enschede. Edited by F.B.M. Min.
Densen, van, and Pet (1988) Fishery in Lake IJssel (IJsselmeer, The Netherlands) a simulation model for the amount of perches.
Mous, P.J. (1989). PERCH, a user-friendly length- and age-structured gillnet fisheries program ten behoeve van/voor o.a. de Nederlandse visserij. Stageverslag / interne publicatie simulatie project; University of Twente, Department of Education, Division of Instrumentation Technology, Enschede & Agricultural Univeristy of Wageningen, department of Fish Culture and Fishery, Wageningen.Stage bij het SLO-TO project vakgroep ISM, TO, (Begeleiding: Van Schaick Zillisen, supervisie: F.B.M. Min). Stageverslag.
Schaick Zillesen, P.G. van, and F.B.M. Min, (1988). Een R. & D. project in de onderwijskunde; een computersimulatiesysteem voor VWO en MBO. In: Onderwijskundige technologie: modellen & emperie (Red. P.H. Been & K.B. Koster) Swets & Zeitlinger, Lisse.