The computer simulation program AORTA with a model about arteriosclerosis.
See also my e-book on internet: chapter 5 with figures xx and xx.
As an example of the preceding paragraphs the various ways of representation of a simple model from the medical section are shown here. The model will be functionally described without really going into detail. For a description of the educational possibilities of this model the reader is referred to the description of the computer simulation program AORTA by Min (1982)
Introduction
In early phase of their studies medical students can familiarize themselves with some basic concepts from hemodynamics and some aspects of arteriosclerosis. In using this program an answer is given to questions like
'What happens if the total peripheral resistance of the circulation is increased?'
The opposite can also be an educational goal, namely the question as to what is the cause of the deviating picture of the diastolic pressure in the aorta.
'Can the cause of a decreased diastolic pressure in the aorta be a decreased compliance of the aorta? Yes or no?'
Students learn to handle notions like compliance and total peripheral resistance and changes there in. Students are supposed to be able to formulate questions and/or hypotheses and to verify these hypotheses with the help of this simulation program.
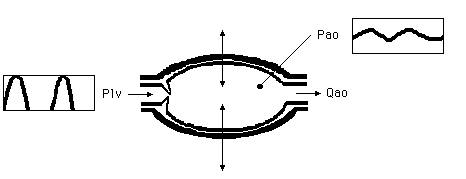
Figure 1. Conceptual model of a beating aorta. On the left blood is supplied
with a certain regularity and on the right blood is transported further into
the body. Changes in the pressure in the aorta of the human body are
indicated by Pao. Plv and Pao are variables.
Within the framework of a course about arteriosclerosis, case studies has been developed about the hardening of the wall of the aorta and the increased total resistance of the peripheral circulation. In this case study the students themselves have to recognize that the mean peripheral stream has changed and they have to try to restore it by adapting the pressure of the ventricle. The program is intended to teach the students how to deal with basal hemodynamic relations such as between pressure, compliance and volume and those between stream, resistance and pressure and to determine the consequences of interventions in hemodynamic variables.
Conceptual model (visual and textual)
The conceptual model of a beating aorta of a human being looks like the drawing in figure 1. The aorta is the great artery which springs from the left ventricle in the heart. The heart pumps (with a certain pressure, here Plv) a quantity of blood through the human body with each heart beat (Qao) attended by a change in pressure in the aorta. The aorta itself is elastic. The quantity which plays a role in the elasticity of the aorta is compliance (Cao). There is a connection between the form of the changes in pressure in the aorta and compliance. Furthermore there is a connection between the blood pressure in the aorta (Pao), the quantity of blood which flows through the aorta (Qao) and the resistance offered by the body (the peripheral resistance, Rp). The interesting variable to be measured externally, 'the pulse pressure', is practically equal to the pressure of the aorta. This pressure varies considerably and is very characteristic.
Block scheme
An inventory of this model, textual represented above, gives the following results:
- ventricle pressure Plv in mmHg (input variables)
- blood pressure in the aorta Pao in mmHg (output variables)
- blood volume Vao in ml (state variable)
- blood flow per time unit (flow) at the entrance of the aorta (Qao) (state variable)
- blood flow per time unit (flow) at the exit of the aorta (which is equal to the total blood
- flow through the body: the peripheral flow) (Qp) (state variable)
- maximum (left) ventricle pressure Plvmax in mmHg (model parameter)
- heart frequency f in 1/sec (model parameter)
- compliance of the aorta Cao (model parameter)
- peripheral resistance Rp (model parameter)
One can speak of one output variable, one input variable, three state variables and four (model)parameters which can serve as intervention possibilities. In figure 2 this is recapitulated in a block scheme. The model in the form of a system of integral equations.
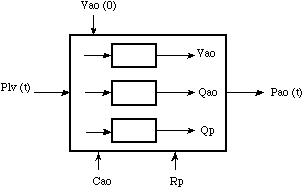
Figure 2. The block scheme of the pressure changes in the aorta. Plv(t) is the input
variable and Pao(t) the output variable. Cao,Rp, Vao(0) and Plv(t) can be used as intervention possibilities.
The pascal way of notation
The model of AORTA consist of four algebraic and one integral equation:
Plv = Plvmax . sin (2 . 3,14 . f . t) ( if Plv < 0 then Plv = 0 !)
Qao = 33 (Plv - Pao) ( if Plv < Pao then Qao = 0 !)
Qp = Pao / Rp
Tmax
Vao = ∫ (Qao - Qp) . dt + Vao(0)
0
Pao = Vao / Cao
NB. Op de plaats van het vraagteken hoort een integraal-teken te staan.
For the sake of convenience, the input variable is approached by half a sinus.
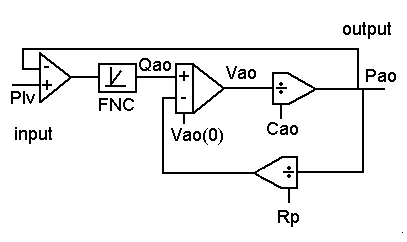
Figure 3. The analogue notation of the model of the pressure changes in the
aorta. The computer simulation program AORTA.
Analogue notation
Of this model a complete analogue scheme can be made as can be seen in figure 3. The non-linear function of conveyance is represented by a function block with the name FNC.
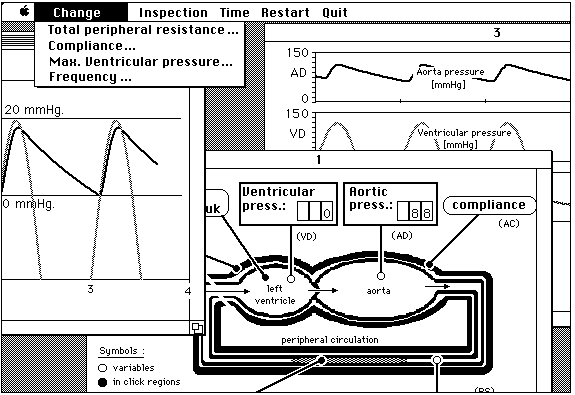
Figure 4. The complete computer simulation program AORTA. One window with the conceptual model and 'inclick regions' and two 'output windows' with different graphical presentations of the model variables.
At the input of the integrator the variable Qao - Qp (a difference of two flows) can be seen. This variable is one volume unit per second and is averaged 0. At the output of the integrator is the variable Vao (a volume with a volume unit). That lines up with what has been said before about an integrator, namely that at the input the variable differs only a factor time from the variable at the output. In this scheme it can be seen immediately that Cao, RP, but also Plv can be used as intervention possibilities. They are independent quantities. They appear not to depend on any other variable.
Pascal notation
The model in Pascal notation looks as follows, apart from details:
Repeat
t := t + dt;
Plv := Plvmax*sin(2 * 3.14 * f * t); if (Plv < 0.0) then Plv := 0.0;
Qao := 33 * (Plv - Pao); if (Plv < Pao) then Qao := 0.0;
Pao := Vao / Cao;
dVaodt := Qao - Pao / RP;
Vao := Vao + dVaodt * dt;
Until t > Tmax
The integration statements (here only one) are best all taken at the end, so that it is certain that the old and new values of the variables will not become mixed up.
Results (with AORTA)
In figure 4 the blood pressure can be seen at specific and characteristic values of peripheral resistance (Rp) and compliance (Cao). In one case built in the program it can be seen that the pressure during the systole has become high and in a second case the medical student can see that the pressure during the diastole is low. A first year medical student has to be able to diagnose in the first case of these 'clinical pictures' that something is wrong with the peripheral resistance and in the second case with the compliance. After that an experiment has to show if a change (upwards or downwards) of the peripheral resistance of compliance brings any improvement. If the 'patient' only becomes worse the students' hypothesis was wrong.

Figure 5. An old experimental JavaTHESIS-version of AORTA (2000). Here you see the result of an intervention with Rp (the peripheral resistance) makes that the lower pressure and so the mean arterial pressure increases.
Enschede, 1995; updated 2003 and 2020