The computer simulation program AXON with a model about the physiology: the Hodgkin and Huxley model for an action potential in an axonMore than 80 years ago action potentials in an axon (figure 1) were first recorded by means of external electrodes by Hodgkin and Huxley (1939). (See figure 2.) Based on the results of their experiments they designed a new revolutionary theory about action potential generation which meant a breakthrough in electrophysiology at the time.
 
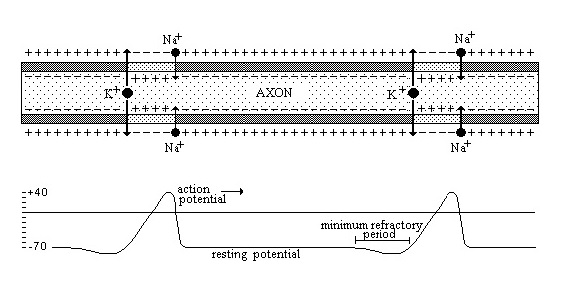
Figure 1. Up: an axon. Midle: the nerve interior en externior during the pass. Down: an action potentials along the nerve. In 1952 Hodgkin and Huxley published a quantitative model of the electrical and electrochemical phenomena in the environment of the membrane of a nerve fiber based on their theory.

Figure 2 The model of Hodgkin and Huxley (1939). The original model of Hodgkin and Huxley was not a mathematical model but an electric circuit (figure 2) consisting of capacitors and resistors. However, it is very simple to transfer this model into a mathematical model. The prototype AXON of the University of Twente is based on such a mathematical model. Educational value Although some of the aspects of the conductivity of the cell membrane were not described correctly by Hodgkin and Huxley, their model is still very useful for the education of medical students and biology students as it can be used as a simplified version of the correct model thus helping the students to build a conceptual 'framework' model which can be filled with the complete and correct conceptual model in a later phase of their education. It can also be used as a demonstration for the experimental research techniques used in cell physiology. Furthermore, the model can be used for biology courses in secondary education, as the differences between the results of the model of Hodgkin and Huxley and the real cell membrane system are not relevant at this level. Model description When the membrane of a nerve fiber is simulated an action potential may be generated depending on the polarization of the membrane. After the generation of an 'action potential' the membrane becomes hyperpolarized for some time, depending on the intensity of the stimulus. For this reason a higher intensity or the right moment in time is required for a second stimulus in order to generate a second action potential (see figure 4 and 5). The program AXON was designed by Scholten & Verhoeven (1987) in order to enable students to experiment with a nerve cell system. Students are able to stimulate the nerve cell twice and to study the resulting phenomena. The starting values of the model are:
IK= - 4.4 IL= 3.2 INA= 1.2 V = 0 <- mV MV = - 90; <- mV The default values of the parameters are:
M=0.052 HA=0.596 GL=0.3 GK=0.3667 GNA=0.0106 t1=1.0 <- start of the first stimulus SD1=0.5 <- duration of the first stimulus SA1=... <- intensity of the first stimulus t2=t1 + SD1 t3=3.0 <- start of the second stimulus, SD2=0.5 <- duration of the second stimulus SA2=... <- intensity of the second stimulus t4=t3 + SD2

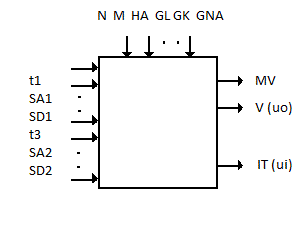
Figure 3. The model of the computer simulation program AXON as a black box. The interventions (the parameters) for the input signal (io=IT): the first pulse ('t1') and the second pulse ('t3'), the duration 'SD1' and 'SD2', and the amplitude 'SA1' and 'SA2' are situated left. The variables V and MV (included IT) are situated on the right. At the top the constants. The most essential parts of the model written in Pascal are:
t := t + dt; BN := 0.125*exp(V/80.0); BM := 4.0*exp(V/18.0); BH := 1.0/((exp(V + 30.0)/10.0) + 1.0); AN := 0.01*(V+10.0)/(exp((V+10.0)/10.0) - 1.0); AM := 0.1*(V+25.0)/(exp((V+25.0)/10.0) - 1.0); AH := 0.07*exp(V/20.0); DN := AN*(1.0-N) - BN*N; DM := AM*(1.0-M) - BM*M; DH := AH*(1.0-HA) - BH*HA; N := N + DN*dt; M := M + DM*dt; HA := HA + DH*dt; GK := 36.0*N*N*N*N; GNA := 120.0*M*M*M*HA; IK := GK*(V - 12.0); INA := GNA*(V + 115.0); IL := 0.3*(V + 10.6); t2 := t1+ SD1; t4 := t3 + SD2; if (T>=t1) and (T<=t2) then IT := INA + IK + IL + SA1; if (T>=t3) and (T<=t4) then IT := INA + IK + IL + SA2; dVdt := IT; V := V - dVdt*dt; MV := - V - 90; Until t > Tmax (* 10 *) The program is designed according to the description of the students' learning environment of MacTHESIS. In this application two windows are present: - In the first window the experimental equipment and the nerve cell are visualized. Students may control the equipment by clicking in the black dots, representing the control buttons of the stimulus generator, conforming to the input-animation technique. - The second window contains a time registration of the polarization of the cell membrane (in mV) and of the intensity of the stimulus (in mA). See figure 4 and 5.

Figure 4. Screendump of the main web-site with the applet of the computer simulation program AXON (in a separate parallel window), based on this mathematical model and build with JavaTHESIS version 3.9x. You see an interventions for the first pulse ('T1') and the second pulse ('T3'). The duration is setting - before running the model from 0 tot the end - with 'SD1' and 'SD2'; and the amplitude is setting with 'SA1' and 'SA2'. The results are as the model calculates and AXON shows during the run.

Figure 5. Screendump of the main web-site with the applet of the computer simulation program AXON (in a separate parallel window), based on this mathematical model and build with JavaTHESIS version 3.9b (Min, 2004) Students may intervene with the model by means of the input-animation technique as described above. Furthermore the same interventions (start of the first stimulus, duration of the first stimulus, intensity of the first stimulus, start of the second stimulus, duration of the second stimulus, intensity of the second stimulus) are possible by means of the menu bar. Rik Min, 1982 - 2004, Enschede. Gerestaureerd in 2020 |