PROGRAM ASPECTS
Chapter 6. Computer simulation program BOILER / SOLAR HEATER
This chapter covers:
- a case study about a technical installation;: a solar heater
- Which parameters can be used in this learning environment?
- Which variables are important for insight or training in this field?
- What are the most important educational aspects and results?
Introduction
The computer simulation program BOILER was developed by a graduate student at the faculty of Educational Science and Technology at the University of Twente. During the development there was cooperation with staff members of the Stichting voor de Leerplanontwikkeling (Foundation for the development of curriculums) Enschede of the project Alternatieve Energie (alternative energy) in elementary vocational education. The computer program is available for Apple Macintosh and MS.DOS computers.
Educational aim
The computer simulation program BOILER enables students to become familiar with the characteristics of a solar boiler and to gain insight into the influences of different interventions in the model around the installation. The model simulates the working of a solar boiler installation consisting of a collector, a storage vessel, a heat exchanger with a pump which runs through the collector and storage vessel and a possibility for tapping. Intervention is possible in the model. For example, students can change the intensity of the sun-rays or the heat capacity of the collector. The students has two screen pages at their disposal. One page with a visualized representation of the underlying mathematical model of the solar boiler installation and a page graphically representing the temperature of the heated water.

Figure 6.1. The conceptual model with the separate segments of the solar boiler as used in the computer simulation program BOILER. The primary circulation contains the collector and pump 1, the secondary circulation contains pump 2 and determines the quantity of hot water that is drained off. Model: Wessels and Tjeng (1981), version Wetteling and Min, (1989).
The target group for the computer simulation program BOILER are students of elementary and secondary vocational education. The object is that the students increase their insight into the working of the installation and its characteristics while working with the program. That is why the students should already have some theoretical knowledge with regard to the solar boiler. So the program can best be used in e.g. a course in which theory is dealt with first. After that they are introduced to the characteristics of the installation through a real solar boiler installation. Finally the students can increase their insight into the working of the installation with the computer simulation program by experimenting with all sorts of interventions which are not possible with a real installation. Three cases have been developed in the computer simulation program BOILER with which the students can practice with the characteristics of the installation in special situations.
The model of the solar installation
The model of the solar boiler installation consists of the following parts:
- the storage vessel,
- the collector,
- the heat exchanger with pump and
- the possibility for tapping.
The storage vessel is completely isolated. It is divided into 10 equal segments. It concerns 10 stagnant layers supposed to be homogeneous of temperature (perfectly mixed). The transport of heat between the segments occurs through enforced convection and conduction. The heating of the water occurs via a connection with the collector. Water is being pumped from the bottom segment through the collector where it is heated and afterwards back again in the storage vessel in any other segment, here segment 5. This is the middle segment. It is possible to tap hot water from the solar installation. This water comes from segment 10, the top segment.
When the temperature of the water in the storage vessel is mentioned the temperature of the water in segment 10 is meant, since it is tapped from there. At the same time water is being pumped back into the vessel in the bottom segment with the temperature of the air outside. Figures 6.1 (conceptual model) and 6.2 (black box model) give a schematic representation of the model of the solar boiler installation, and 6.3 a graphic representation on the screen of the model.
The intervention possibilities in the model of the solar boiler are:
Other un-named parameters and their values:
- zs = 18000000
- ref = 126000
- pref = 1
- izs = 0
The temperature of the water in the collector (T11) and the temperature of the water in the 10 segments of the storage vessel (T1 to T10) are all equal to 10oC at the beginning of the simulation.
- T1 = 10
- T2 = 10
- T3 = 10
- T4 = 10
- T5 = 10
- T6 = 10
- T7 = 10
- T8 = 10
- T9 = 10
- T10 = 10

Figure 6.2. Blockscheme computer simulation program BOILER. On the left the parameters, on the right the output variables and at the top the starting values of the output variables T1 until T10, the temperature in each segment, including T11, the temperature of the heating segment.
The block scheme of this model looks as indicated in figure 6.2.
The descriptions and the exact values of the intervention possibilities Fz, Fv and Ccol are rather complex. In this intervention a standardization has been chosen for educational reasons. In the normal situation these parameters are equal to 1 for the student. He can change them during the simulations in such a way that they can take values between 0 (completely switched off) and 4 (4 times the normal value).
The model is implemented in computer simulation system MacTHESIS. The computer language used is Pascal. The listing of the model is as follows:
Repeat
	t  :=  t + dt;
	if ((t>6.0) and (t<18.0)) or ((t>30.0) and (t<42.0)) or ((t>54.0) and (t<66.0))
		then 	begin
			fz :=  zs*sin((t-6)*6.28/24);
			fv:= ref*(T11-T0);
			izs:= (fz / zs)*100;
			end
		else 	begin
			fz :=  0.0;
			fv  :=  0.0;
			end;
 	dT11dt := (Cwat*Fp*(T1-T11)+Fz-Fv) / Ccol;
 	T11 :=  T11+ dT11dt*dt;
 	if (Fp >= Fs) then
 	 begin
	    dT10dt := (Fs *(T9-T10) + (gel*(T9-T10))/Cwat)/Vseg;
	    dT9dt := (Fs *(T8-T9) + (gel*(T10-2*T9+T8))/Cwat)/Vseg;
	    dT8dt := (Fs *(T7-T8) + (gel*(T9-2*T8+T7))/Cwat)/Vseg;
	    dT7dt := (Fs *(T6-T7) + (gel*(T8-2*T7+T6))/Cwat)/Vseg;
	    dT6dt := (Fs *(T5-T6) + (gel*(T7-2*T6+T5))/Cwat)/Vseg;
	    dT5dt := (Fp *(T11-T5)+(gel*(T6-2*T5+T4))/Cwat)/Vseg;
	    dT4dt := ((Fp-Fs)*(T5-T4) + (gel*(T5-2*T4+T3))/Cwat)/Vseg;
	    dT3dt := ((Fp-Fs)*(T4-T3) + (gel*(T4-2*T3+T2))/Cwat)/Vseg;
	    dT2dt := ((Fp-Fs)*(T3-T2) + (gel*(T3-2*T2+T1))/Cwat)/Vseg;
	    dT1dt := (Fp*(T2-T1)+Fs*(T0-T2) + (gel*(T2-T1))/Cwat)/Vseg;
	end else
	begin
	    dT1dt := (Fs*(T0-T1) + (gel*(T2-T1))/Cwat)/Vseg;
	    dT2dt := ((Fs-Fp)*(T1-T2) + (gel*(T3-2*T2+T1))/Cwat)/Vseg;
	    dT3dt := ((Fs-Fp)*(T2-T3) + (gel*(T4-2*T3+T2))/Cwat)/Vseg;
	    dT4dt := ((Fs-Fp)*(T3-T4) + (gel*(T5-2*T4+T3))/Cwat)/Vseg;
	    dT5dt := ((Fs-Fp)*(T4-T5) + (gel*(T6-2*T5+T4))/Cwat)/Vseg;
	    dT6dt := ((Fs-Fp)*(T5-T6) + (gel*(T7-2*T6+T5))/Cwat)/Vseg;
	    dT7dt := ((Fs-Fp)*(T6-T7) + (gel*(T8-2*T7+T6))/Cwat)/Vseg;
	    dT8dt := ((Fs-Fp)*(T7-T8) + (gel*(T9-2*T8+T7))/Cwat)/Vseg;
	    dT9dt := ((Fs-Fp)*(T8-T9) + (gel*(T10-2*T9+T8))/Cwat)/Vseg;
	    dT10dt := (Fp*(T11-T9)+Fs*(T9-T10) + (gel*(T9-T10))/Cwat)/Vseg;

  	end;
  	T1  :=  T1 + dT1dt*dt;
  	T2  :=  T2 + dT2dt*dt;
  	T3  :=  T3 + dT3dt*dt;
  	T4  :=  T4 + dT4dt*dt;
  	T5  :=  T5 + dT5dt*dt;
  	T6  :=  T6 + dT6dt*dt;
  	T7  :=  T7 + dT7dt*dt;
  	T8  :=  T8 + dT8dt*dt;
  	T9  :=  T9 + dT9dt*dt;
  	T10  :=  T10 + dT10dt*dt;
Until  t > Tmax   (* 24  hour *)

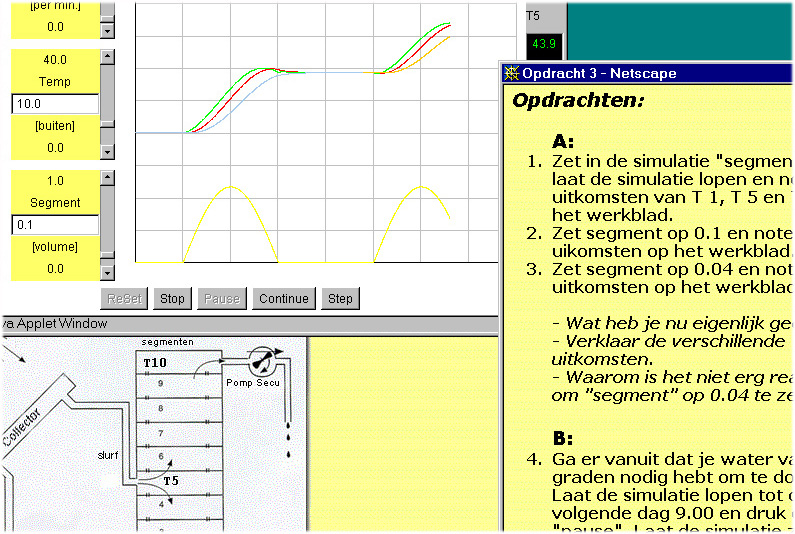
Figure 6.3. Screen dump of the graphic output of a certain simulation session with the computer simulation program BOILER, the Dutch version with two parallel instructions: a scheme and a text with an exercise. (Min, 2000)
Results
The students have 7 intervention possibilities (parameters) at their disposal in the computer simulation program BOILER:
- the intensity of the sun;
- the reflection of the collector;
- the heat capacity of the collector;
- the pump which pumps the water (the primary circuit) through the collector;
- the drain-pump (the secondary circuit);
- the outside temperature and
- the volume of the storage vessel.
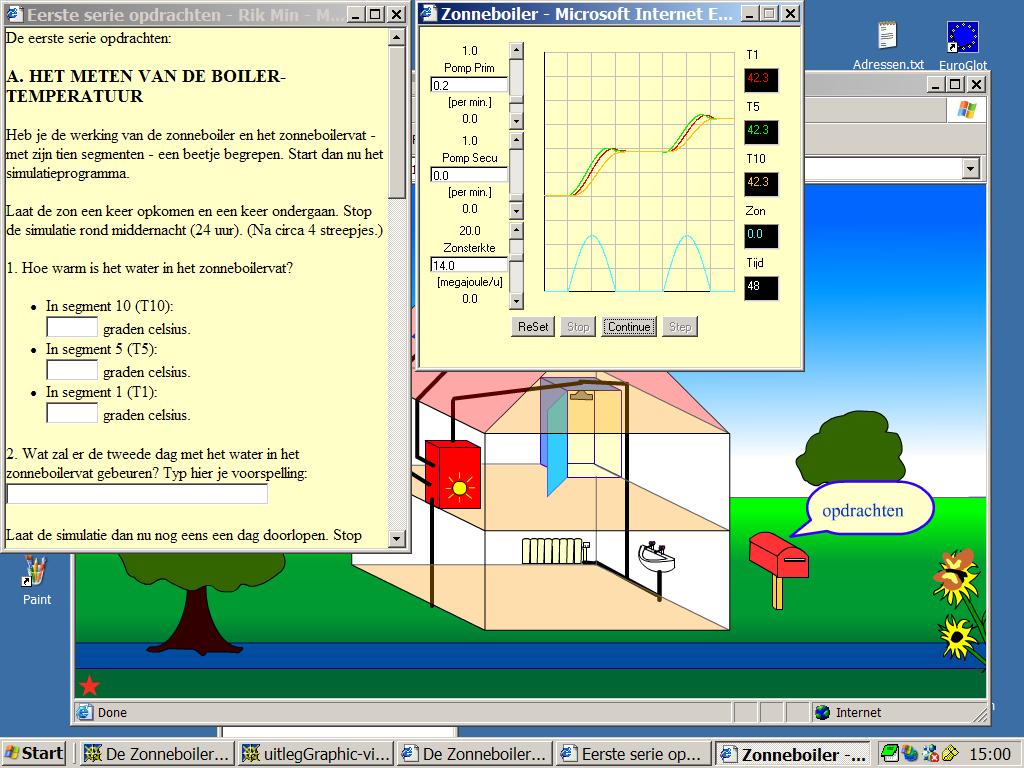
In the visualized model on the 'animation screen' the student sees the following parameters and variables represented in the form of decimal counters: time, the value of the pump through the collector, the value of the drain-pump velocity and the temperature of the water in the storage vessel. The student sees two graphs on the second page (the 'output page'). In the top graph the temperature of the water in the storage vessel is represented, the most important output variable in the model. In the bottom graph the position of the sun is more or less represented. The only thing to be seen is half a sine-shaped curve which begins at 6 a.m. and ends at 6 p.m. and which reaches its maximum at midday (simulation time). This graph is intended as a point of reference for the student so that he or she can see whether the sun is rising or setting and 'how high the sun is at that particular moment'. In figure 6.3 the visualized mathematical model of the solar heater can be seen and in figure 6.4 a situation of a simulation session can be seen which is made with the computer simulation program of an output page and some other pages from the computer simulation program BOILER.
Cases
With the MacTHESIS system it is possible to include a number of cases into a computer simulation program. These are special situations in which one or more parameters are adjusted beforehand and a certain characteristic, well-defined situation is generated on the screen. Once the user understands the program, he or she can start to work with such a special situation.The user can follow this, step by step, with the help of a worksheet or a workbook on which the situation is explained. In such a workbook a number of exercises and cases are posed on the basis of which the student learns to work in that situation.

Figure 6.4a. Screen dump of a version of the simulation site, BOILER version 2002, with the visualized mathematical model of the solar installation, an instruction window and a output window for graphical and numerical output, parallel to the home page. (INF/TO students & Min, 2002)

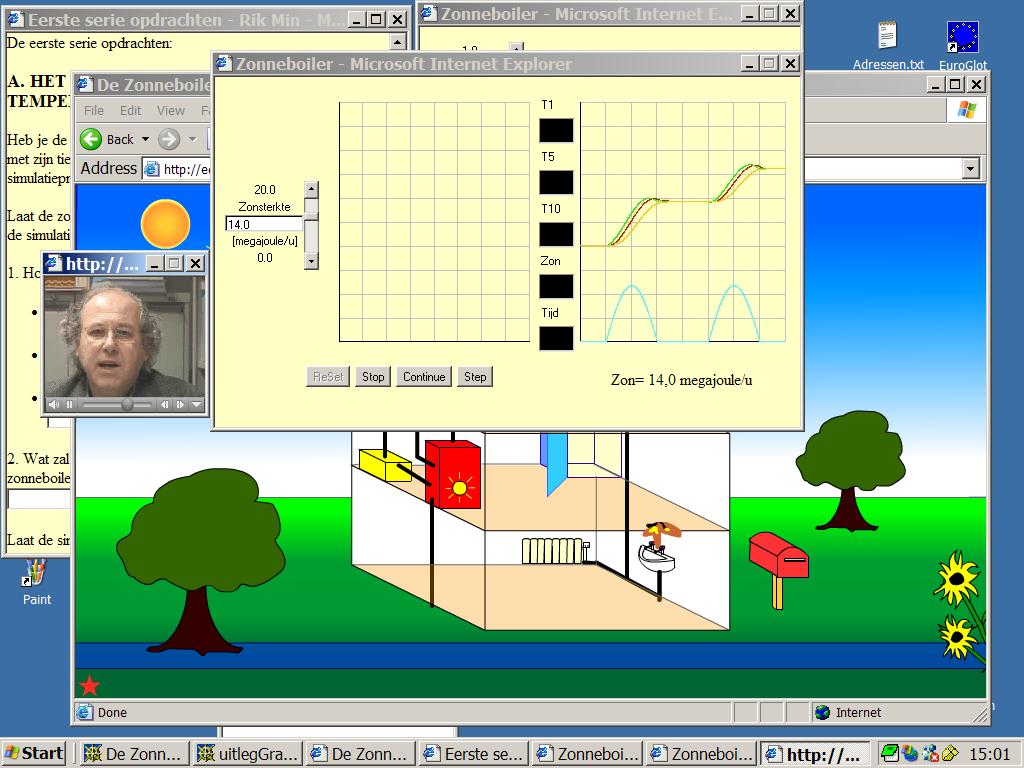
Figure 6.4b. Screen dump of a version with a simulation site, BOILER version 2002, with the metaphore of the same solar installation and with parallel instruction: a video coach. You also see an example of output and a problem: "try to do the same as in the example..." (INF/TO students & Min, 2002)
In the program (or applet) BOILER, the user can choose from about three cases beside the 'normal situation'. In the first place a case in which the solar boiler is placed in the tropics. The user has to imagine that he or she is in a marketplace in the middle of Africa. The intensity of the sun (Fz) which is normally 1 (standard value) is in this case equal to 3.6. The outside temperature (T0) is in this case 350C. The intention of this case is that the student imagines himself in a situation in which (much) more energy of the sun is available but now it has to be considered how this energy can be used optimally. The second case works with a collector with a very high heat capacity (Ccol = 3.5; the default value was 1) and a very low reflection (Fv = 0.1; the default value was 1). This means that the collector converts solar heat into the heat of the water very effectively. The point in these cases is that the student learns to work with the differences which can appear in the quality of the collectors. The third case deals with the situation in which the drain leaks (fs = 0.05 m3/hour). It is also very cold in this case (the outside temperature T0 = 1 0C). The repair of the drain is impossible in this case so the student has to manage somehow to heat the water in the boiler. The purpose of this is that the student tries to deal with mechanical defects and the characteristics of this boiler under cold circumstances.
Discussion
The program has been evaluated with students from the target groups. Some things that emerged from this were: It is very important that a computer simulation program is accompanied by good and clearly written material with questions and assignments. Since small mistakes in the formulation can have far-reaching consequences in the process of learning, all details are important. Furthermore it appears that the way in which a student reaches a solution to an assignment is of essential importance in the processing of the program. In order to reach such an optimum result the exercises must inspire the students and appeal to their creativity.
A big advantage of computer simulation programs like BOILER is that they can be adapted for other target groups through other cases and accompanying material, even though they have been developed for a certain target group. It is also rather easy to translate the texts in the program into another language so that computer simulation programs can also be used as an educational tool for students with a different language. This can be done with a so called resource editor together with a graphic editor (e.g. MacPaint or PixelPaint). The first prototype of the computer simulation program BOILER was completed in January 1988. The last prototype appeared at the end of 1989. In this prototype a disturbing error in the model has been corrected and the trunk of the primary circuit is situated in segment 5, so that the heat currents in the 10 segments of the boiler are clearly visible under fluctuating charges.
Enschede, 1997; updated with new pictures october 2002.
Note
This chapter is original first writen in Dutch by J. Wetterling and F.B.M. Min and published in SCOPE Nieuws, a Dutch journal for CAL specialists and teachers. Later, it is rewriten for an internal paper, in English, by F.B.M. Min and J. Wetterling.


