Place by place (updated) - Step by step (NEW)
JavaTHESIS, your design system for simulations on the web
JavaTHESIS is a universal design system for learning environments based on simple and solid simulations and specially designed for (complex) mathematical models. The system is designed and developed by Rik Min, Jacob Sikken en Jan de Goeijen. The system is based on a java-file and a library ('SimLib') and generates applets.
JavaTHESIS is based on concepts and ideas from the MacTHESIS system (Min, 1990). It is a design method based on 'sjablones'. We sometimes say: 'shells' or 'templates', because knowledge about programming in java isn't necessary. The designer only have to change something in the two sjablones on 27 different places. It is a matter of "cutting the old parts and pasting the new parts" (Min, 2002). You have to change - step by step - the old simulation 'CASCADE' into a new simulation.
The system
The javaTHESIS system - in the representation of 'CASCADE' - you can see them here. Also the sources of the two 'slablones', 'shells' or so called 'templates'. With this 3 files you can built your own simulator. The simulator becomes an applet; a java-applet. This java-applet can be implemenated in your own web-site.
The 3 files are:
- The class-file (in a dummy web-page) (with the dummy CASCADE-applet):
- The HTML-file (or 'sjablone' or 'template') (with the applet):
- The java-file (or 'sjablone' or 'template) (with the model):
The library 'SimLib', with the other files, are conditionally available on this web-site.
There are 27 parts in the javaTHESIS system, versie 3.9x (version CASCADE). The first serie of 14 parts in the HTML-file (number 1 to 14) and the second serie of 13 parts in the java-file (15 to 27). The most important parts in this 'cut and paste'-system are the model (24), the starting values (21), the decalaration list (16) and the name of the simulator (3 and 15). We call them the 'degrees of freedom' in our system. In each applet you can put one mathamatical model. There is no limit in size of the model. Even more than 600 java statement or equations, isn't a problem.
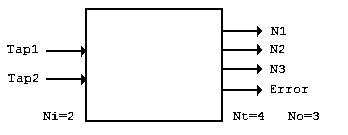
The simulation-applet have 'output elements' and 'input elements' as 'graphs', 'scroll bars' and 'counters'. The number of graphs, scroll bars and counters determine mostly the outlook of your simulation. These determinants are 'Ni', 'No' and 'Nt':
- Ni - the number of input elements ('scrollbars').
- No - the number of output variabeles ('graphs').
- Nt - the number of counters ('tellers' in Dutch).


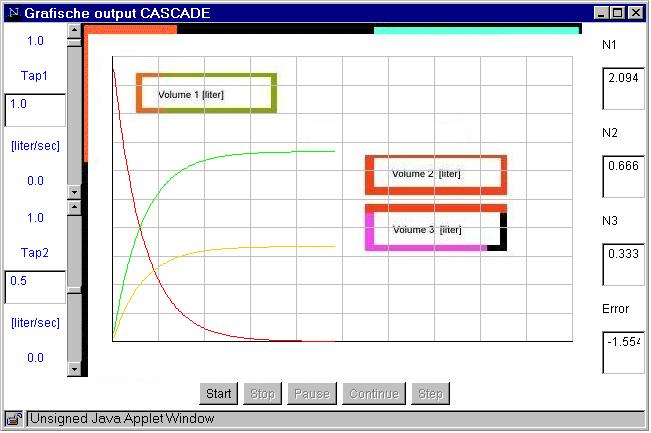
Here you see the applet in relation to the underlying mathematical model. The applet is defined by 27 parts. You see the model - as blackbox - and the output window. The most important parts of the simulation (here) are the visible input parts and the visible output parts, as:
- 1. Two scrollbars for the two parameters 'Tap 1' and 'Tap 2', for the intervention into the mathematical model (so Ni=2).
- 2. Three graphs for three of the four variables, 'Volume 1' in Red, 'Volume 2' in Blue and 'Volume 3' in Green, for the graphical output as a function of time (so No=3).
- 3. Four counters, with the four variables 'N1', 'N2', 'N3' with the names 'Volume 1', '2' and '3' and the extra variable 'Error', for decimal output (so Nt=4).
- 4. The background with additional bitmapped text and color, is a file, made in Photoshop or Paint, which gives you the oportunity to put extra information behind the normal parts of the output.
- 5. There is a grid of 10 by 10 colloms and rows with a small area between them at the left, right, top and the bottom of this background: here all 30 pixels ('offset').
In the simulation-applet you have the freedom to use more than 20 scroll bars; more than 20 counters and more than 20 graphs if you like. The filling-in of the number of 'output elements' ('No'), 'input elements' ('Ni'), 'counters' ('Nt'), 'maximum simulation time' ('Tmax'), 'starting time of the simulation' ('Tmin'), 'integration step size' ('dt'), etc., and such as 'Ymax', 'Ymin', 'Pmax', 'Pmin' and 'Name', and such things, is a step by step process. They are all parts of the concept and the 'degrees of freedom' of our system. Each part or degree of freedom has an unique number (here 1 to 27). In the files we reffer to this unique numbers. Here you see these 27 parts; part by part and place by place; in random order.
In the classroom, L102, during the course, there is a large poster at the wall with the marked points and places (1 to 27).
27 Parts - Place by place
IN THE HTML-SOURCE
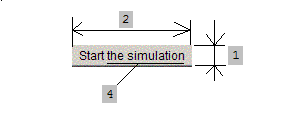
Place 1, the button size (height):
You have to change the height of the space around the push button ('height') by cut the old value and paste the new value on this place (here: 35) (pixels)
Place 2, the button size (width):
You have to change the width of the space around the push button ('width') by cut the old value and paste the new value on this place (here: 120) (pixels)
Place 3, the name of the code-file of the applet:
You have to change the name and the name of the file with the code of the class ('Code') by cut the old value and paste the new value on this place (here: 'Cascade.class') See also point 15.
Place 4, the label:
You have to change the text in the button as a button label ('appletName') by cut the old value and paste the new value on this place (here: the simulation)
Place 5, the background filename:
You have to change the filename of the background in the background-file ('backgroundfile') by cut the old value and paste the new value on this place (here: 'Background.jpeg').
The background is a file, made in Photoshop or something, and - if your applet is finished - it gives you the oportunity to put extra information into the graphical part of the output.


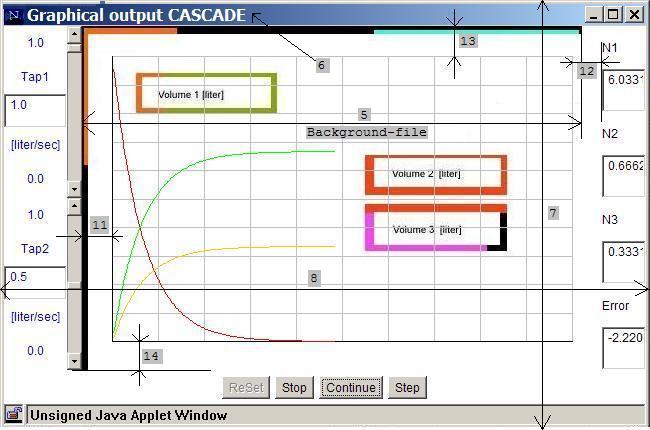
Design: here you see the most important visible parts of the design of your applet:
- Place 1, 2 and 4: the buttom and the size
- Place 5: the background-files
- Place 6: the window-name
- Place 7 and 8: the window size
- Place 9 and 10: the grid
- Place 11, 12, 13 and 14: the empty space between the grid and the other parts.
Place 6, the window name:
You have to change the name of the applet-window (the text in the header) ('windowName') (here: Graphical output CASCADE).
Place 7, the window height:
You have to change the height of the applet-window ('windowHeight') (here: 450) (pixels)
Place 8, the window width:
You have to change the width of the applet-window ('windowWidth') (here: 650) (pixels)
Place 9, the grid vertical:
You have to change the number of grids in t-direction; vertical ('nrOfTGrids') (here: 10)
Place 10, the grid horizontal:
You have to change the number of grids in y-direction; horizontal ('nrOfYGrids') (here: 10)
Place 11, the space around the grid, left:
You have to change the empty space left in the background ('leftOffset') (here: 30) (pixels)
Place 12, the space around the grid, right:
You have to change the empty space right in the background ('rightOffset') (here: 30) (pixels)
Place 13, the space around the grid, on top:
You have to change the empty space on top in the background ('topOffset') (here: 30) (pixels)
Place 14, the space around the grid, at the bottom:
You have to change the empty space low underneath the background ('bottomOffset') (here: 30) (pixels)
IN THE JAVA-SOURCE
Place 15, the name of the applet:
You have to change the name of the class-file of the applet ('public class') (here: Cascade). See also point 3.
Place 16, the declaration list:
You have to change (by cut and paste) the identifiers in the declaration list, such as the names of all variabeles, parameters, constants, etc. in java ('double'). Here: N1,N2,N3,K1,K2,Error,dN1dt,dN2dt,dN3dt;.
Place 17, the parameters:
You have to change the scrollbars for the parameters of the model ('NumberChooser') and the number of them: 'Ni'=2:
a. the nickname of the parameter (a textstring) (here: 'Tap 1' and 'Tap 2')
b. the unity of the parameter (a textstring) (here: '[liter/sec]' and [liter/sec])
c. the default value of the parameter ('P0') (here: 0.0 and 0.0)
d. the minimum value ('Pmin') (here: 0.0 and 0.0)
e. the maximum value ('Pmax') (here: 1.0 and 1.0)
Place 18, the graphs:
You have to change the graph in connection to the variabeles ('YGraph') and the number of them: 'No'=3:
a. the variabele (here: N1, N2 and N3)
b. the color of the graph (here: 'red', 'green' and 'orange')
c. the minimum value of the scale below ('Ymin') (here: 0.0, 0.0 and 0.0)
d. the maximum value of the scale on top ('Ymax') (here: 1.0, 1.0 and 1.0)
e. the nickname: here: in the background picture
e. the unity: here: in the background picture
Place 19, the times:
You have to change the maximal and the minimal simulation time of the simulation run:
a. the 'maximal simulation time' ('Tmax') (here: 10.0 sec)
b. the time on which the simulation has to start ('Tmin') (here: 0.0 sec) (mostly 0; but can be such as 2002)
Place 20, the integration time:
You have to change the 'integration time' or 'integration step' (in the integration method of Euler) ('dt') (here: 0.03 sec)
Place 21, the starting values:
You have to change the starting values of all variabeles, incl. the default values of all parameters, constants and others ('initModel'). Here:
N1=1.0;
N2=0.0;
N3=0.0;
K1=1.0;
K2=0.5;
t=0.0;
Place 22, the default value (of a parameter):
You have to change the initialisation of the scrollbars. The scrollbars are the possibilities to interact with the model. (See point 17.)
Place 23, the actual value (of a parameter):
You have to change the actual value of the scrollbars is given to the model. (See point 17.)
Place 24, the mathematical model:
You have to change (by cut and paste) the mathematical model. Here:
dN1dt = - K1 * N1 - K2 * N1;
dN2dt = + K1 * N1;
dN3dt = + K2 * N1;
N1 = N1 + dN1dt * dt;
N2 = N2 + dN2dt * dt;
N3 = N3 + dN3dt * dt;
Error = 1.0 - (N1 + N2 + N3);
Place 25, the expert system:
You have to change the rules (for fuzzy logic) (in java) (if you want)of the internal expert system. That is done by checking the rules in the applet, in the loop, where the model is. Here:
if (N1<0.01) {"the upper tank is as good as empty"};
Place 26, the output:
You have to change the numbers of the output elements (if you want). You can present the value of a variable into a graph or into a counter.
- a. graphical outputs (here: 3) (3 graphs) (so 'No'=3).
The colors here are 'red', 'green' and 'orange'.
- b. outputs with counters (here: 4) (4 counters) (so 'Nt'=4).
The nicknames (next to the counters) here are - by any chance - 'N1', 'N2', 'N3' and 'Error'.
You have the freedom to change the number of some objects (if you wants). When you want and do this, you have to copy and paste some statements. Be careful.
- 'Ni', the number of input elements ('scrollbars'). You have to declare - just the amount you need - the statements with 'Input1' and 'Input2'.
- 'No', the number of output variabeles ('graphs'). You have to declare - just the amount you need - the statements with 'Graph1', 'Graph2', Graph3.
- 'Nt', the number counters ('tellers'). You have to declare - just the amount you need - the statements with 'Text1', 'Text2', 'Text3' and 'Text4' and the statements with 'Label1', 'Label2', 'Label3' and 'Label4'. See the java source and than you understand it.
From this kind of objects you always take more or less. Be attention to declare this in the top of the source-listing.
Place 27, the design:
If you want to have more than 3 input elements (Ni) ('GridLayout') with more than one colors ('setColor') ; and more than 3 counter elements (Nt) with more than one colors you can change the design. At this moment NI=2 and No=4. Here:
See the listings. On the listings you find the information in bold and the number at the right. You have to change the model-information of CASCADE (by cutting) into your information (by pasting).
Operating instructions - Step by step
Phase 1
Step 1. First of all you need to buy, copy or get the two files 'Cascade.html' and 'Cascade.java' with the sjablones, from Rik Min, for your own PC, disk or floppy and for your own simulation. Mostly you can find Rik Min in room L219. If not: make an appointment.
Step 2. Rename the two files from 'Cascade.html' and 'Cascade.java' into 'Xxxx.html' and 'Xxxx.java' with the new name you want to have. See point 3 and 15.
Step 3. Collect all the information about your model. You need at least all the model equations in pascal, basic, javascript or java.
Most of the statements of a model are assignments and sometimes if-statements. The most important parts about our mathematical models you can find in my book from Academic Book Center (1996)
Phase 2
Step 4. Cut the old Cascade-model (point 24) out of the source; and paste your new model into this space (point 24).
Step 5. Cut the old the starting values (point 26) out of the source; and paste the new starting values into this space (point 26).
Step 6. Cut the old declaration list (point 21) and paste or make a new declaration list here (point 21).
Do it on a smart way; no typing; copy and paste it from old ascii-files of Rik Min. Typing induce much errors and later on: so called 'compilation errors' (in java).
Step 7. Do nothing more at the two sjablones. Print the two files. Take rest. Take a cup of coffee.
Phase 3
Step 8. Take your new listings and cross off all the old information and data from the model 'Cascade' on the sheets. Fill in by pencil the new information or data.
Tip: If you have no information or you are not sure about a value, string or a character: do nothing.
Step 9. Accept in this phase - before you compile yuour source code for the first time - that your simulation has 3 graphs (No=3), 4 counters (Nt=4) and 2 sliders (Ni=2). See point 26 and 27.
Step 10. Print your new source. Check your source visual. Circle the important newe parts by pencil. Check the old parts.
Phase 4
Step 11. First time compiling. If you have errors go to Rik Min. He will have a visual look to your source together with you.
Step 12. If you haven't java errors, than redefine No, Nt and Ni. Ni is the number of input elements ('scrollbars'); No the number of output variabeles ('graphs') and Nt the number counters.
Step 13. Copy each statement: just 1, 2, 3 or more (6?) times. Change the numbers from 1 into 3, 4, 5 or 6 or more.
Step 14. You have to declare InputX, TextX, GraphX and LabelX in top of the file, just the amount and name it with the number it needs.
Input1, Input2 until Input4, Input5 or Input6;
Graph1, Graph2, Graph3 until Graph4, Graph5 or Graph6;
Text1, Text2, Text3, Text4 until Text5 or Text6;
Label1, Label2, Label3, Label4 until Label5 or Label6.
Additional information
Colors in the counters. See version 3.9c (color) and ask Rik Min for the source(s).
No extra window. Delete 3 lines (and ask Rik Min which 3 lines).
Parallel instruction. See all our examples on our Java-site (but ask also Rik Min).
Simulation with intelligent feedback. See version 4.0v (video) and ask Rik Min for the source(s).
Examples
Example 1 with colors. To understand this options you have to look to the example 'AORTA'. There you see the colored counters.
Example 2 with colors. To understand this options you have to look to the example 'BOILER'. There you see a full colored background.
Example 3 with colors and parallelism. To understand the option parallel instructions you have to look to the example 'SUN HEATER'. There you see the applet parallel and some parallel 'instructions'.
Index
- model: point 24
- name: point 3 and 15
- variable: point 16, 18, 21 and 26
- parameter: point 17
- time, t
- simulation time, the value of t
- simulation run, time between Tmax and Tmin
- Tmin: point 19
- Tmax: point 19
- dt: point 24
- Pmin: point 17
- Pmax: point 17
- P0: point 17
- unity of a parameter: point 17
- nickname: point 17
- Ymin: point 18
- Ymax: point 18
- Y0: point 18
- unity of a variable: point 18
- color of graph: point 18
- leftOffset: point 11
- rightOffset: point 12
- topOffset: point 13
- buttomOffset: point 14
- number of grid in t direction: point 9
- number of grid in y direction: point 10
- input elements
- output elements
- number of output elements, No: point 18 and 26
- number of input elements, Ni: point 17 and 26
- number of counters, Nt: point 26
Enschede, sept. 7, 2000; updated jan. 15, 2002.


